Bitcoin's Spot Demand Turns Positive for First Time Since February 2026
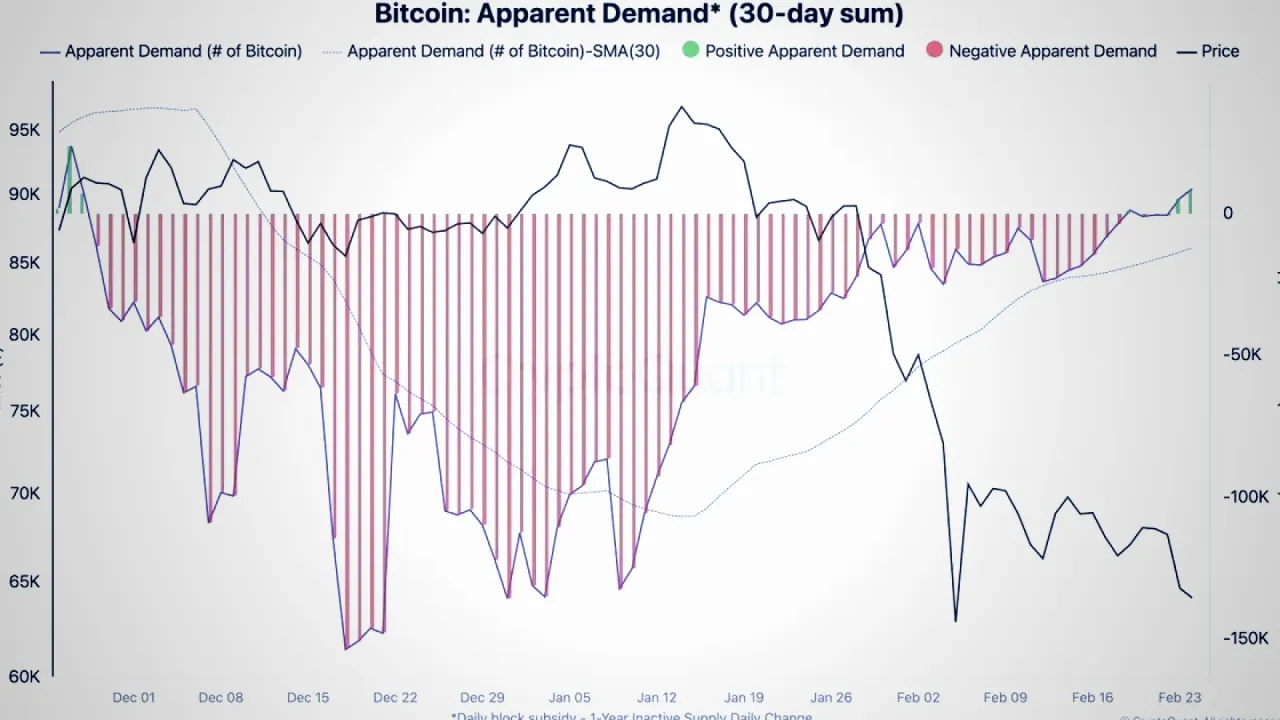
Bitcoin's on-chain demand has recently turned positive, marking a significant shift after remaining negative since February 2026. According to CryptoQuant's "apparent demand" metric, which assesses net buying pressure by comparing new supply against dormant and exchange-held coins, the metric has climbed to approximately +25,000 BTC.
This positive reading, confirmed on August 18, is the first since February when Bitcoin was trading between $64,000 and $65,000. The turnaround is noteworthy as the metric had previously reached a low of about -147,000 BTC in May, coinciding with Bitcoin's price stagnation around $60,000.
Institutional interest has played a crucial role in this recovery, with cumulative net inflows into U.S. Bitcoin ETFs surpassing $52 billion by mid-August 2026. A notable daily inflow of $297.5 million suggests that large investors are actively building positions rather than remaining passive.
Historically, the first two months of 2026 saw strong demand, driven by ETF approvals and post-halving narratives. However, enthusiasm waned in the spring, leading to increased leverage in derivatives markets and a retreat from spot buyers. As a result, the apparent demand metric had plummeted, reflecting a lack of confidence in the market.
The recent positive reading, while encouraging, is still modest at +25,000 BTC. Analysts suggest that sustained ETF inflows will be critical in determining whether this trend can lead to a more significant market rally. If daily inflows remain positive and occasionally spike, it could indicate that institutional demand is establishing a structural floor for Bitcoin's price.
As miners operate on thinner margins post-halving, periods of negative demand often correlate with increased selling pressure from miners. Therefore, if demand continues to be positive and prices stabilize, miner selling pressure may ease, potentially supporting a more robust market environment.
Updated 16:32 UTC
Latest Insights on Bitcoin's Market Dynamics
As of mid-August 2026, VanEck's Bitcoin ChainCheck report indicates that eight out of twelve capitulation signals are currently active, suggesting a potential near-term bottom for Bitcoin prices.
Bitcoin is currently trading around $63,700, reflecting a significant drawdown of 30-45% from its cycle peaks, and has been consolidating between $60K and $70K.
VanEck's analysis suggests that the simultaneous activation of these capitulation indicators points to miner struggles and elevated realized losses, which historically precede market recoveries.
The firm views these capitulation events not as signs of failure but rather as contrarian buy signals, aligning with Bitcoin's typical four-year halving cycle.
Historically, periods of miner capitulation have led to positive returns, as the forced selling clears out weaker participants and stabilizes the market.
Updated 16:32 UTC
Latest Insights on Bitcoin Demand
- Google searches for "buy bitcoin" have reached a one-year low, with a Google Trends score of 21 as of mid-May 2026.
- This marks a significant drop from the peak score of the last week of February 2026, which was the highest since February 2021.
- During this period, Bitcoin has been trading between $74,000 and $80,000.
- Search interest for the broader term "crypto" has also declined, falling to a score of 26 to 30, down from a peak of 100 in August 2025.
- Despite lower search interest in the US and UK, regions like Nigeria and Singapore are showing stronger engagement with crypto-related queries.
- The rise of Bitcoin exchange-traded funds (ETFs) has allowed institutional investors to enter the market without needing to search for "buy bitcoin." This shift indicates a change in how large capital flows into Bitcoin.
- The current market dynamics suggest a phase of quiet accumulation, as Bitcoin's price remains stable despite the decline in search interest.
Updated 17:02 UTC
Latest Insights on Bitcoin
- Bitcoin's price is currently at $64,713, reflecting a nearly 2% increase in the past day.
- The cryptocurrency has experienced a 27% decline year-to-date and has lost almost half of its value since reaching an all-time high of $126,080.
- BlackRock's iShares Bitcoin Trust was approved by the SEC in January 2024, becoming the most successful Bitcoin ETF in terms of investment and trading volume.
- BlackRock maintains that Bitcoin serves as a hedge against government debt and currency debasement, reinforcing its role as a global monetary alternative.
- Despite Bitcoin's inherent volatility, it has shown a trend of decreasing volatility over the past decade, aided by the maturation of market structures and the growth of derivatives markets.
Updated 18:01 UTC
New Insights on Bitcoin's Market Dynamics
- BlackRock and VanEck released reports explaining the factors behind Bitcoin's 50% crash, attributing it to extreme leverage and capital rotation into AI funds.
- BlackRock's report highlights that futures open interest reached over $90 billion, with 80% in offshore perpetual contracts offering up to 125x leverage.
- After the announcement of new China tariffs on October 10, 2025, forced liquidations resulted in a $20 billion loss in open interest in just one day.
- VanEck's ChainCheck indicates that eight out of twelve capitulation signals are currently active, suggesting the market may be nearing the end of its correction phase.
- The current drawdown has lasted for ten months, which is close to the historical average of 11 to 13 months for such cycles.
- Both firms suggest that the current market conditions may lead to a shallower trough compared to previous cycles, as no major lender has collapsed this time.
- BlackRock models a 1% to 2% allocation to Bitcoin as beneficial for a 60/40 portfolio, while VanEck notes that capitulation buys typically yield results only after one year.
Updated 18:31 UTC
Latest Insights on Bitcoin Market
- Bitcoin's thirty-day realized volatility has decreased to 27.2% annualized, down from 30.4% the previous month.
- The current volatility is less than half of Bitcoin's long-run average of approximately 80%.
- Bitcoin is currently about 9% below its 200-day moving average, a decrease from a 14% discount observed a month ago.
- Spot trading volume has decreased by 27% over the trailing 30 days, landing in the 10th percentile of its historical range.
- Approximately 356,000 BTC (-2.9%) held for more than a year were sold in the past month, reducing the long-term holder share of total supply below 60% for the first time in months.
- 8 out of 12 tracked capitulation signals are currently indicating potential market bottoming, with a possible timeframe for this bottom between September and November 2026.
FAQ
What does the positive on-chain demand for Bitcoin indicate?
The positive on-chain demand indicates a shift in net buying pressure, suggesting that more Bitcoin is being bought than sold, which may signal increased confidence in the market.
What is the 'apparent demand' metric?
The 'apparent demand' metric assesses net buying pressure by comparing new Bitcoin supply against coins that are dormant or held on exchanges, providing insight into market demand.
How much have U.S. Bitcoin ETFs seen in cumulative net inflows?
By mid-August 2026, U.S. Bitcoin ETFs have surpassed $52 billion in cumulative net inflows, indicating significant institutional interest in Bitcoin.
What factors contributed to the recent increase in Bitcoin demand?
The increase in Bitcoin demand can be attributed to ETF approvals, post-halving narratives, and a notable daily inflow of $297.5 million from large investors.
What could happen if the positive demand trend continues?
If the positive demand trend continues, it could lead to a more significant market rally, potentially easing selling pressure from miners and establishing a structural floor for Bitcoin's price.
Comments
Comments are moderated before publish.
No comments yet — be the first.